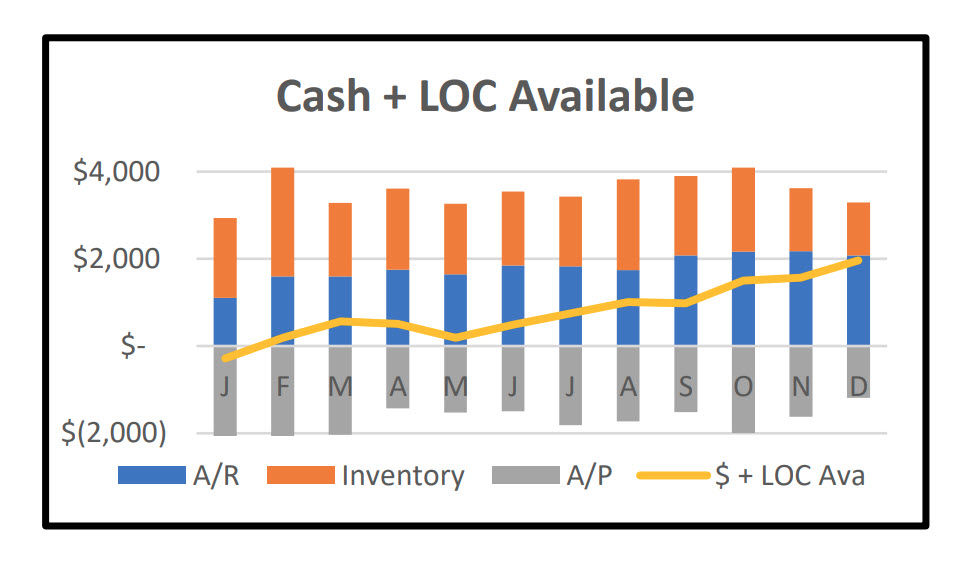
Graph # 8 of 8 From Company Dashboard - How is Your Balance Sheet? Do You An Available Balance on Your Line of Credit?
- Jeff Pape
- Dec 31, 2021
- 2 min read
Updated: Mar 19

Our last graph in the one page dashboard series shows several of your top balance sheet accounts that you should be monitoring - Accounts Receivable, Inventory, Accounts Payable and your available Cash Plus your Line of Credit Available. The first three balance sheet accounts are shown with the bar graphs and the Cash Plus your Line of Credit Available is shown in the line graph.
Accounts Receivable and Inventory are shown as positive numbers. The Accounts Payable balance is shown as a negative number.
What is great about this graph is you get a visual representation of all these numbers in one place. You can quickly get an idea of how these balances are trending.
Are Increases in Accounts Receivable A Good Sign?
An increase in Accounts Receivable can be a sign of an increase in sales, but it could also indicate a problem. For example, in an effort to increase sales the credit department may have granted credit to businesses that are not going to pay their invoices owed to you (and your A/R will increase).
A Decrease in Accounts Payable Can Be A Bad Sign
Same thing could happen with your Accounts Payable balances, be sure to understand any large changes. A quick decrease in your A/P could indicate you are paying your bills faster than you need to. Similarly a decrease in payables could also mean your company is not buying necessary supplies to run its business. Be sure to understand any large increases as well - the changes could be both positive and negative scenarios.
Increases of Inventory May Be Justified
Inventory fluxes should be understood too. Just like A/R and A/P changes could be positive or negative. They might be explained due to seasonal changes in your business. You may need to increase your inventory because your peak season is approaching or you had to purchase inventory for a large upcoming order.
Do You Have Enough Cash or LOC To Pay Your Bills?
The line graph on this chart is a combination of your current Cash balance plus the available balance on your Line of Credit. Why would you want to know this number? Your cash balance plus your available Line of Credit shows you what your company has available to pay its bills in the short term. Your LOC should smooth out your cash flow challenges and allow you to pay your bills.
Next up the final blog post in this series. A glimpse of the one page document and a peak behind the Excel table that powers the graph.
コメント